To perform some tests, I interfaced the following modules to a Fuelino Proto2 board:
- Catalex MicroSD module, for data logging on micro SD card. Interfaced using SPI communication protocol (6-pin connector).
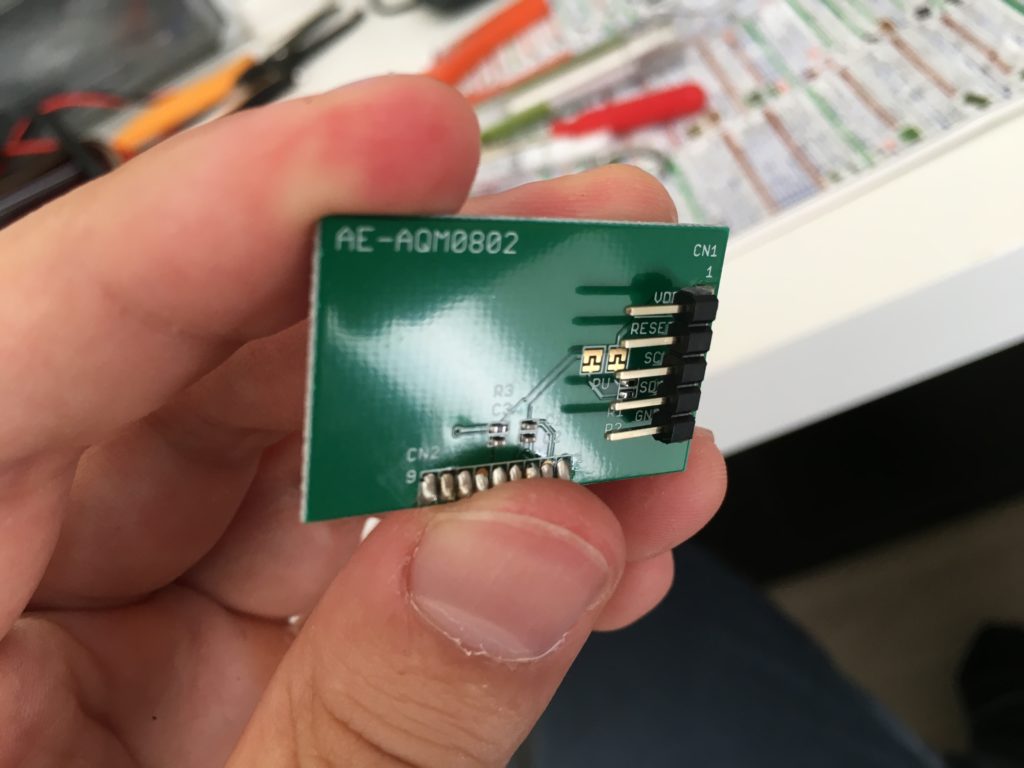
- LCD module (AE-AQM0802), for real time data visualization. Interfaced using I2C (TWI) protocol (4-pin connector).
The picture below shows how the LCD display module looks like (back side). Only 4 pins are required:
- VDD (5V). Power supply from Arduino Nano.
- SCL. I2C clock from Master (Arduino Nano r3).
- SDA. Data from Master (Arduino) to Slave (LCD display).
- GND (0V). Power supply and signal reference from Arduino Nano.
The following video shows the behaviour of Fuelino, when it is stimulated with an injection signal coming from Pico DrDaq module. The input signal has a 5% duty cycle (fixed) and variable frequency (10Hz, 20Hz, 30Hz), which corresponds to a period of: 100ms, 50ms, 33.3ms.
The acquired and calculated data is logged on the Micro SD card (Catalex module). At the moment, the logging frequency is not set to a fix value (it depends on the loop cycle time, and SD card access latency time), but it is slightly variable around 130ms. With some software modifications, I am planning to reach a fixed logging period around 50ms (20Hz).
At the moment, Fuelino is capable of logging the following data, when connected to a motorcycle (or car):
- Time after Power ON [ms]. Read using the millis() function of Arduino IDE.
- Combustion cycle number. How many injections (= combustions) have been performed.
- Time period between one injection and the next (2 crankshaft rotations) [us].
- Engine speed [rpm]. Calculated using the previous measurement.
- Injection time [us]. This is the injection command pulsewidth coming from the original ECU.
- Throttle Position Sensor voltage signal [V].
- Lambda sensor voltage [V].
- Injection time extension [us]. This is the increment of injection time performed by Fuelino.
- Interrupts execution time [us]. Just for debugging purpose.
In the example below, I plotted the data acquired during the test (see video above):
- When stimulating with 10Hz (100000us period), the calculated engine speed is 1200rpm. And the fuel injection time measured is 5000us (which corresponds to a 5% duty cycle).
- When stimulating with 20Hz (50000us period), engine speed is 2400rpm. Fuel injection time measured is 2500us.
- When stimulating with 30Hz (33333us period), engine speed is 3600rpm. Fuel injection time measured is 1666us.


